FM Detection and Debug View
FM Receiver App – Week 5 Update
This week, I made progress in the following features:
- Implemented a FM Scanner
- Implemented features from debug view
FM Scanner
Compared to last week, this week’s approach to detecting FM stations is completely different. I decided to shift from using peak detection to a new method: computing the sum of frequency bins around each candidate frequency raster, then normalizing the data and applying a threshold. This approach was suggested by my mentor and a community member, FunkyLab. It leverages our existing knowledge about FM stations to help detect them more effectively.
This approach takes advantage of the fact that FM stations are aligned to a 100 kHz raster—you’ll never find a station at, say, 87.765 MHz.
However, since the output size is unknown, I couldn’t implement the entire logic within a single GRC flowgraph. Instead, I split the process: the scanning is handled by a flowgraph, and I wrote a custom Python function to perform the detection.

The flowgraph above computes a \(2^7 = 128\) point FFT over a 2.048 MHz bandwidth centered around a given frequency. This means each FFT bin covers a bandwidth of:
\[\text{Bin Bandwidth} = \frac{2.048 \times 10^6}{128} = 16,000 \text{ Hz}\]This information is useful because it allows us to estimate the size of an FM station in terms of bins. Since a typical FM station occupies approximately 200 kHz, the station size in bins is:
\(\frac{200 \times 10^3}{16 \times 10^3} = 12.5 \text{ bins}\) That means to compute the power around a candidate station, you take 7 bins to the left and 7 bins to the right (14 bins total), sum their magnitudes, and assign the result as the power of that station candidate.
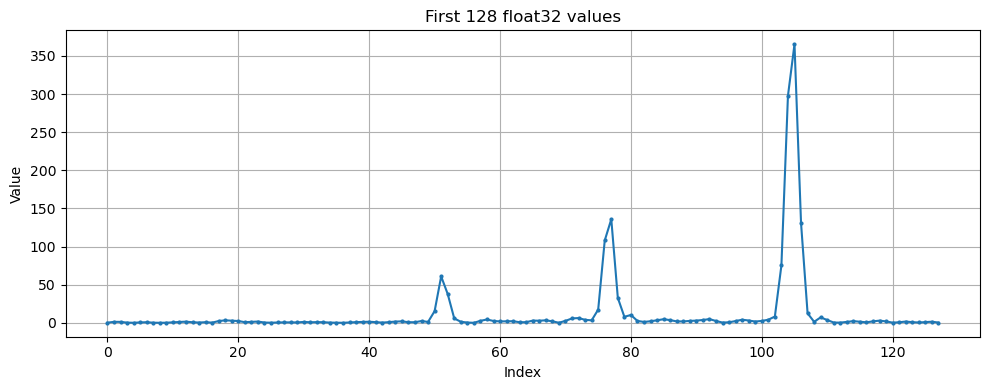
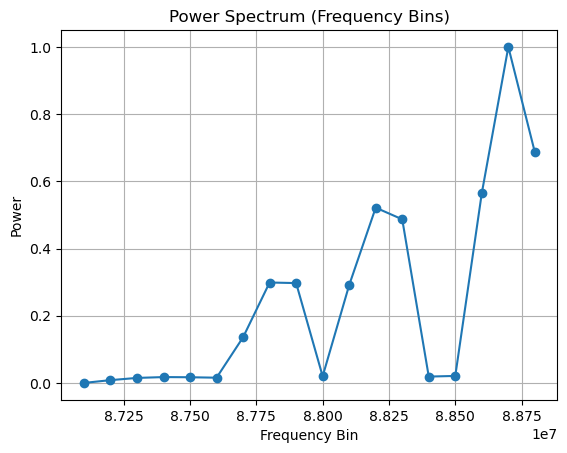
Source Code: You can check out my detection function here: src/fm_receiver/utils/fm_scanner.py.
Problem with this approach
Now, there are some limitations to this approach, since we’re normalizing the data:
-
Noise Amplification
If no channel falls within the bandwidth, this amplifies the noise. Additionally, if one channel significantly peaks above the rest, the threshold might fail to detect lower-power channels. -
Adjacent Frequencies Detected as Stations
A second limitation is that adjacent candidate frequencies might be individually detected as stations. However, this can be easily overcome by eliminating adjacent frequencies and selecting the candidate with the highest power sum, since we know that stations should be at least 100 kHz apart. -
Non-GRC Approach
The detection logic is a Python function. This breaks my modular design principle of wanting to run all DSP components within GNU Radio flowgraphs, and keep the code focused on the frontend. -
Sharing SDR Resources
For now, my approach is todelthe flowgraph variable in Python to detach the SDR kernel before running the FM scanner. I also usedQThreadto prevent the application from freezing during the scanning process.
Accuracy
This simple FM detector identifies up to 23 stations using my Nooelec Smart v5 and LNA configuration. I haven’t done much experimentation yet, but so far all detected stations are legitimate — I verified them by listening.
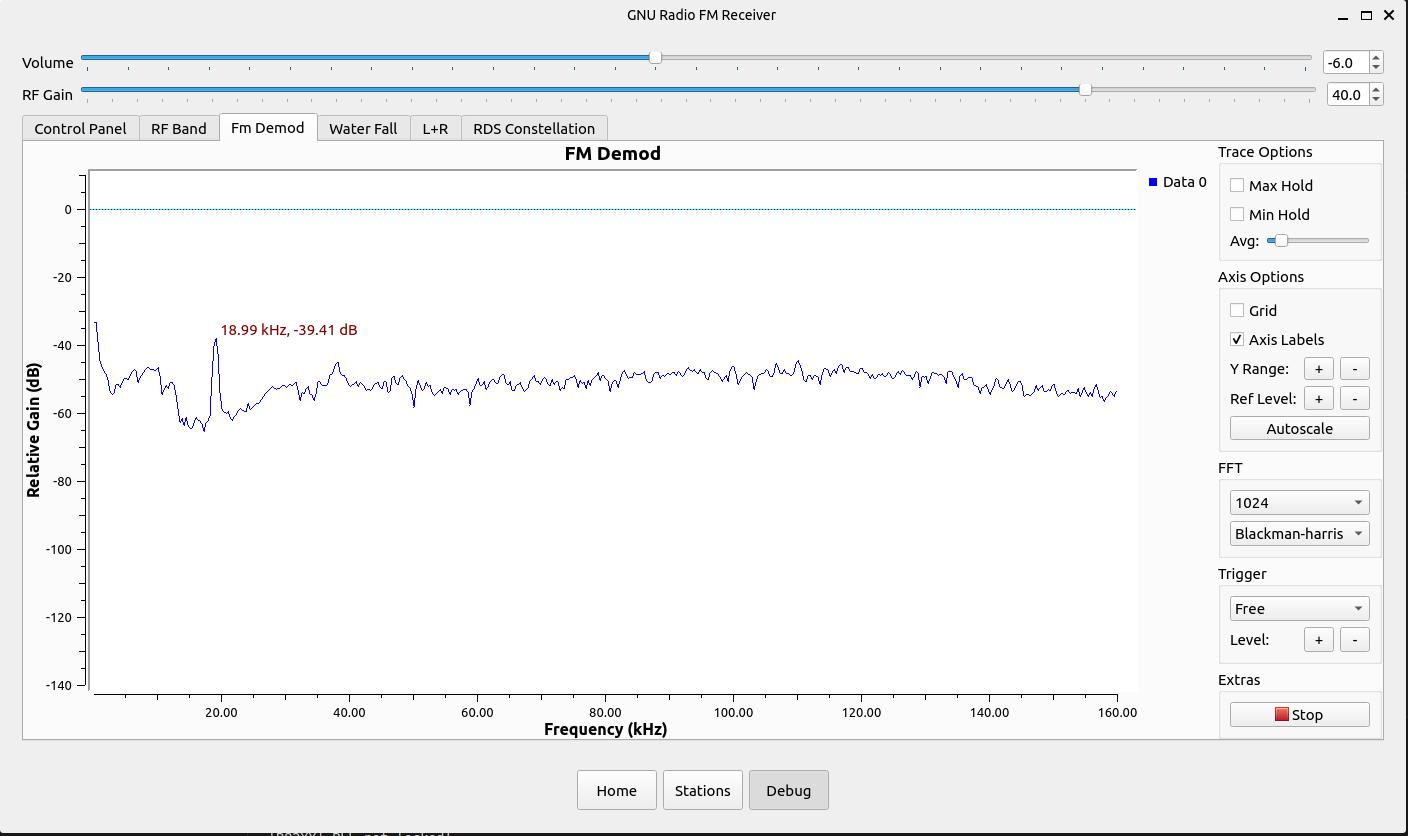
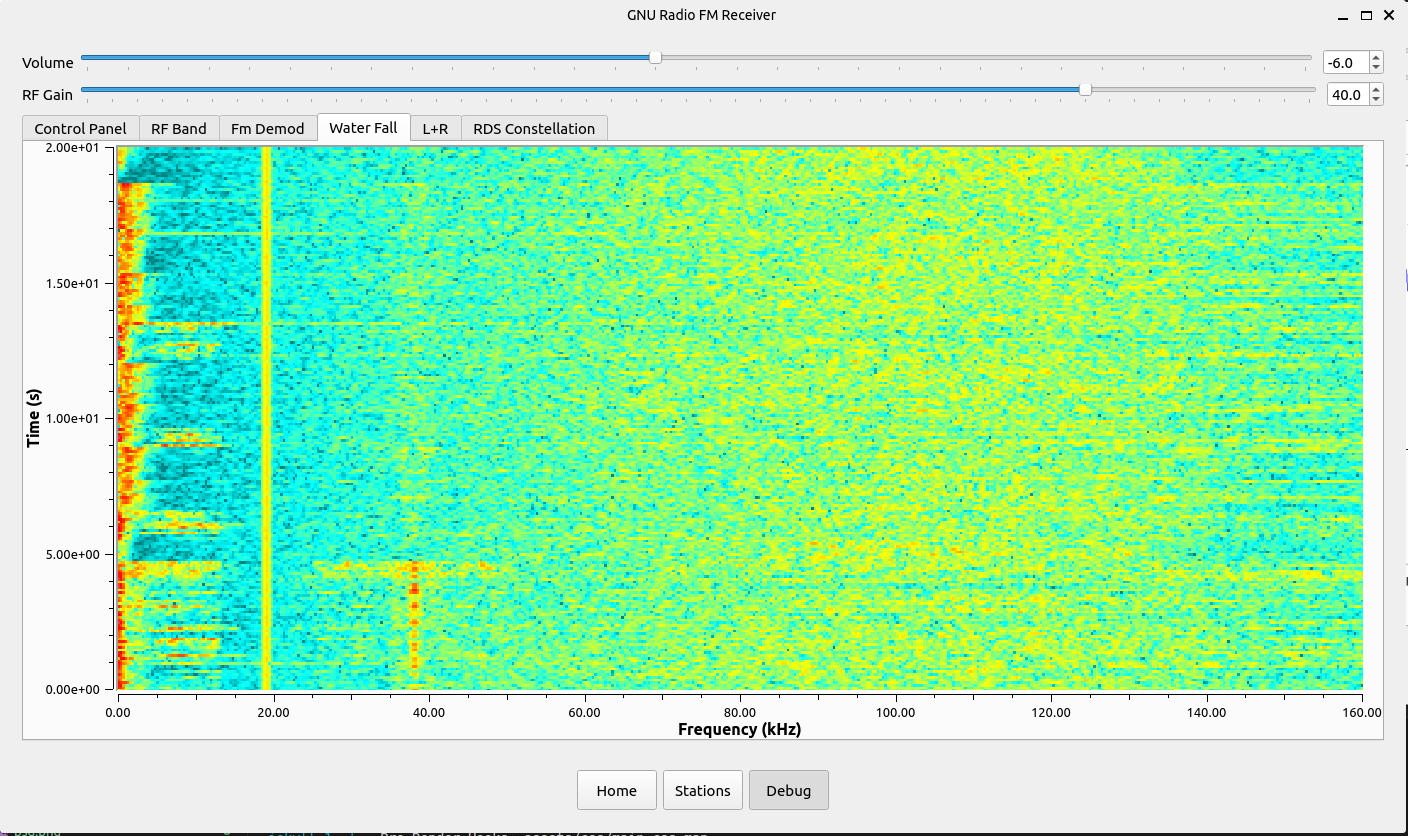
Another possible verification approach is to detect the 19 kHz pilot tone in the FM-demodulated signal. Which brings us to the next topic, the debug view.
Debug View
The debug view is not complete yet. I’ve added some visualizations, but there should be more control over flowgraph variables such as filter taps, FM bandwidth, gain, volume, squelch, and other parameters.
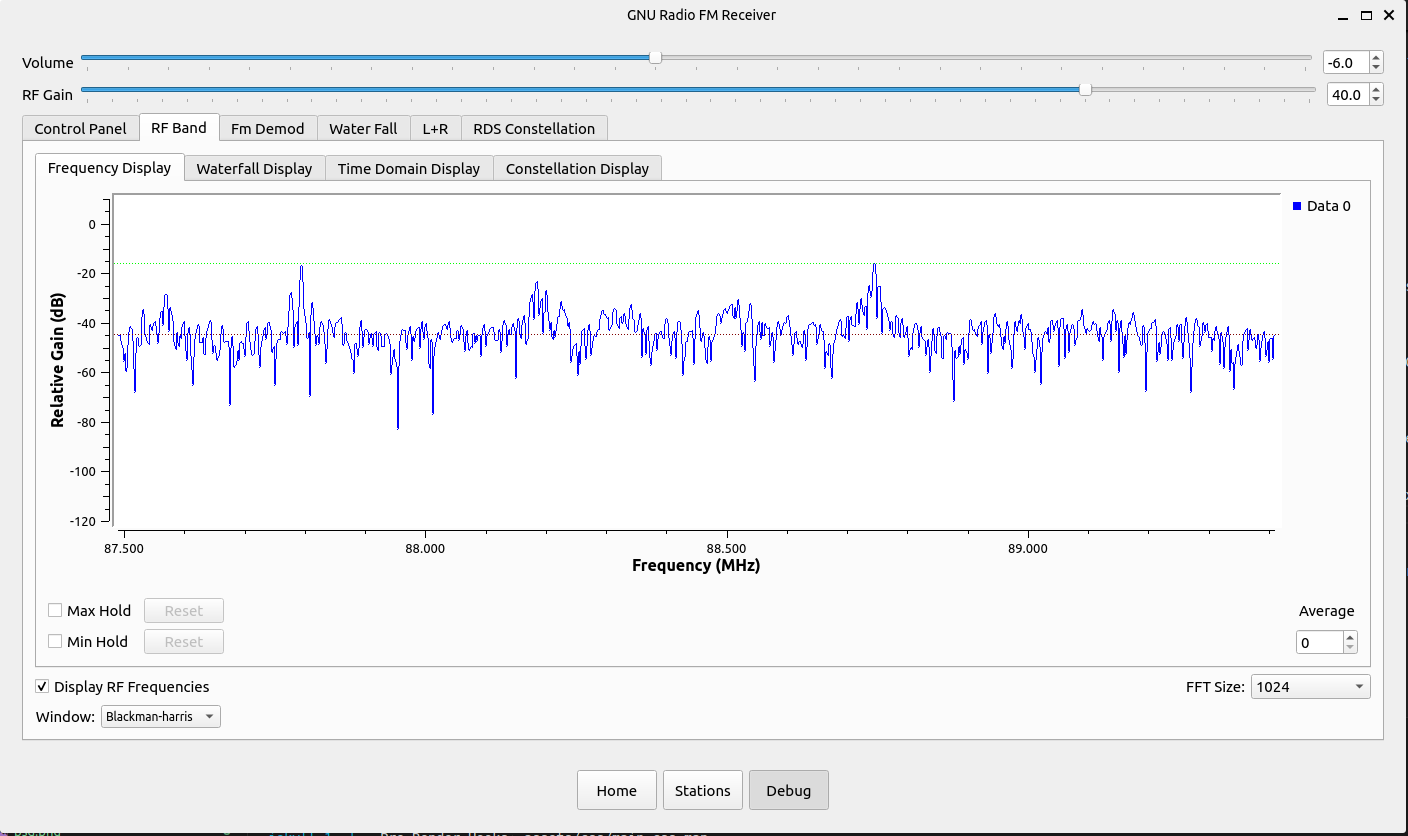
Currently, there are four tabs:
- Rf band — 1024-point FFT of the scanned FM bandwidth
- Waterfall — FFT representation of the filtered FM signal before demodulation
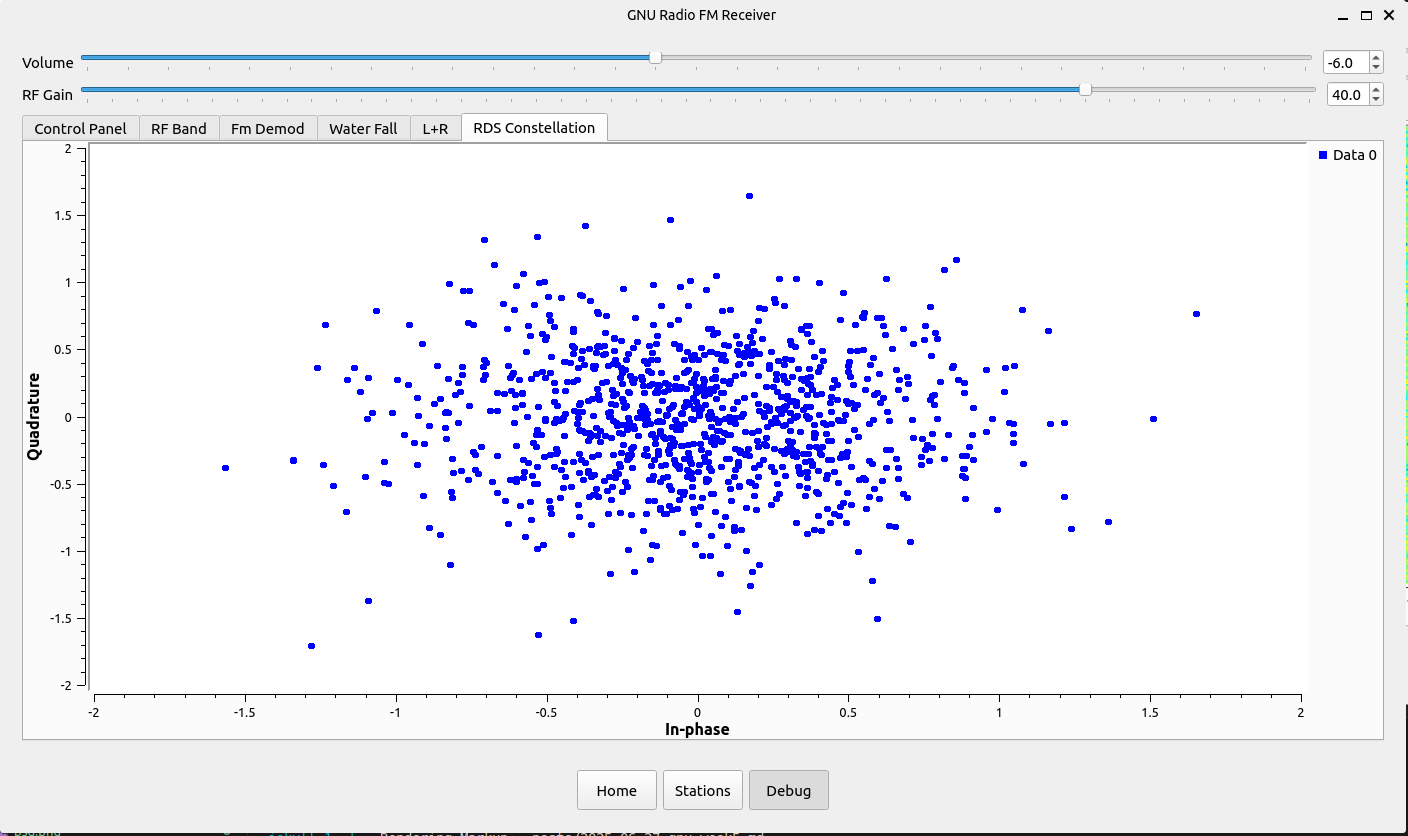
- RDS panel — Constellation diagram for RDS (Radio Data System)
- FM demod visualization — Time-domain or spectral view of the FM-demodulated audio
In the debug view looks like this:

Improvement Ideas
I need to find a way to improve the scanning part in the following areas:
-
Efficiency
Currently, I detach the SDR kernel by deleting the flowgraph object (del). A better approach would be to manage SDR access more gracefully, without fully tearing down and rebuilding the flowgraph. -
Interactivity
The scanner currently just outputs logs. I’d like to make it more interactive — for example, by integrating progress indicators, real-time spectrum updates, or UI feedback to improve the user experience. -
Debug View Customization
I need to add more control variables to the debug view to allow users to customize parameters such as filter taps, FM bandwidth, gain, squelch, and volume in real time.
What’s Next?
For next week, I’m planning to:
- Enhance Advanced/Debug view, add more control
- Polish frontend
- Add record stream feature
Links
Enjoy Reading This Article?
Here are some more articles you might like to read next: