RDS integration and FM Detection
FM Receiver App – Week 4 Update
This week, I made progress in the following features:
- Integrating gr-rds rds panel into my frontend application
- Improve over all GUI and add stylesheets
- Attempt to Create FM Scanner
RDS Integration & UI Change
Following my last blog, integrating the RDS into my app was a piece of cake. First I moved things around, made some improvement to the UI. The new UI looks like this:
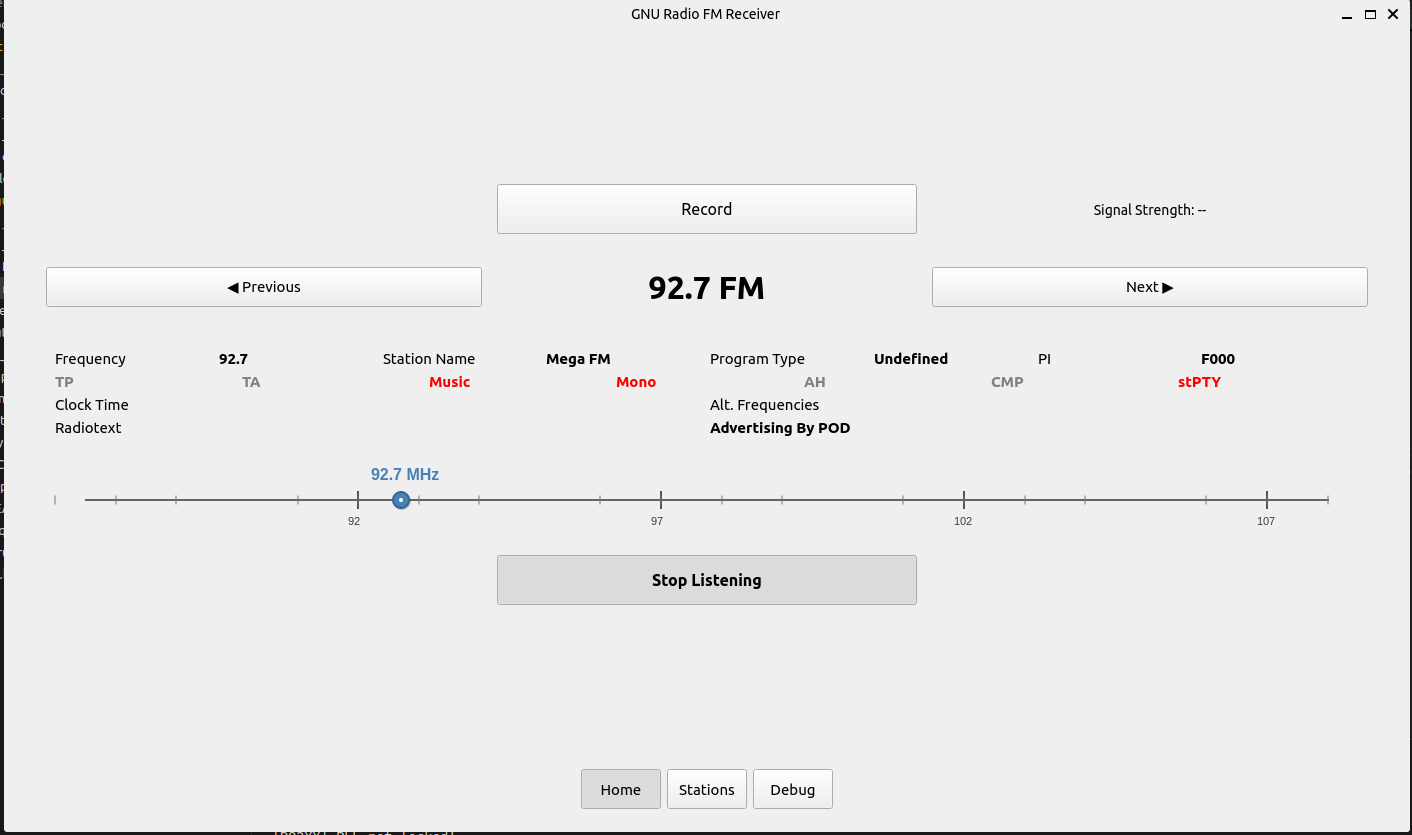
Then I used the RDS panel of the gr-rds OOT module in my application. First i had to import the new flowgraph block from flowgraphs.rds_rx import rds_rx then instantiate the new FM Receiver self.rds_fm_receiver = rds_rx() and save the variable self.fm_receiver = self.rds_fm_receiver, finally add the self.rds_info = self.fm_receiver.rds_panel_0 to the home widget.
Frequency Scanning
My initial approach was to scan the spectrum, get the Power Spectral Density to identify candidate stations by their power and verify candidate stations are actually FM station by attempting demodulation and looking for 19kHz pilot tone.
So in attempt to build the scanner, I first started working on the PSD part of the flow graph.
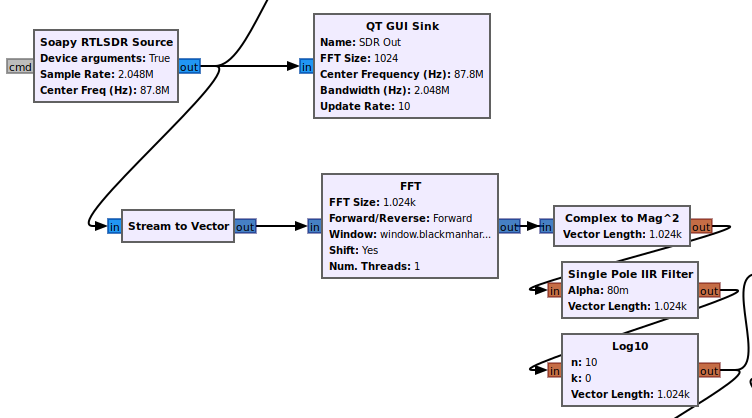
\[\text{PSD}(f) = 10 \cdot \log_{10} \left( |\text{FFT}(x(t))|^2 \right)\]In the flowgraph it looks like this:
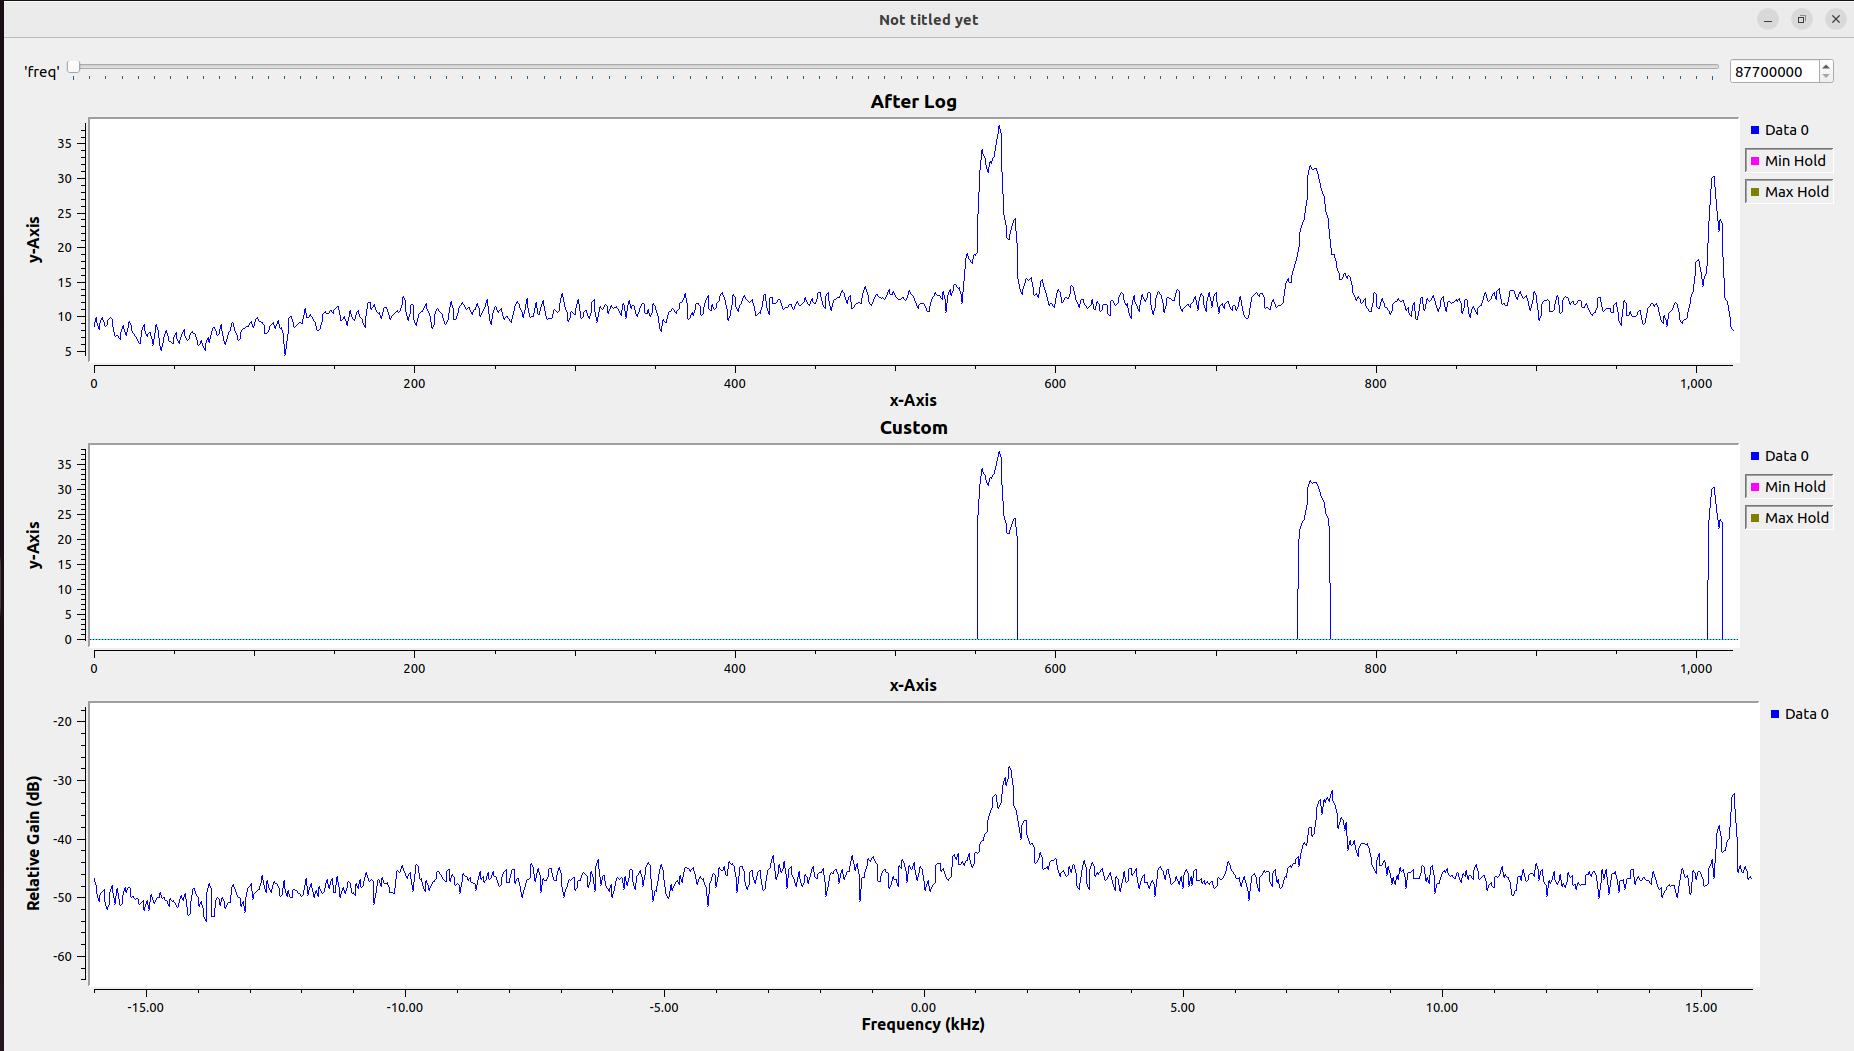
This is my first attempt with a embedded python block to threshold the values.
Other Attempts of thresholding are :
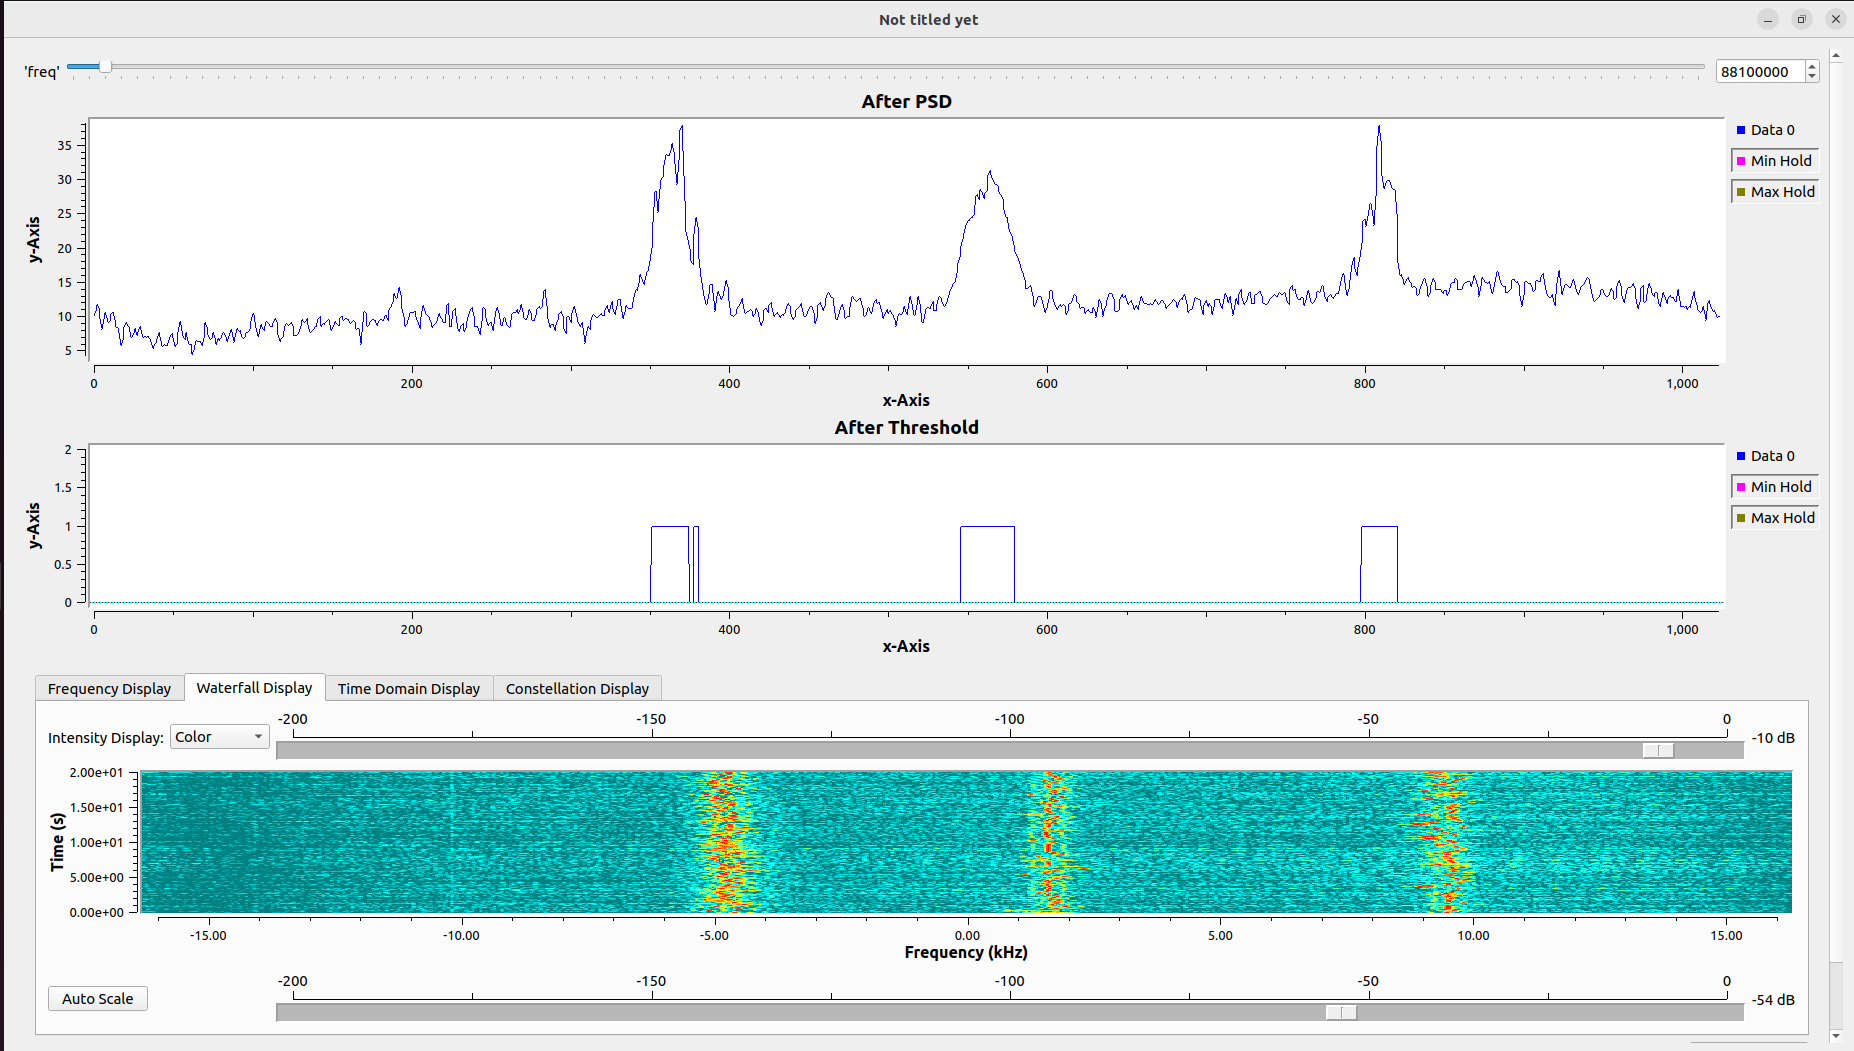
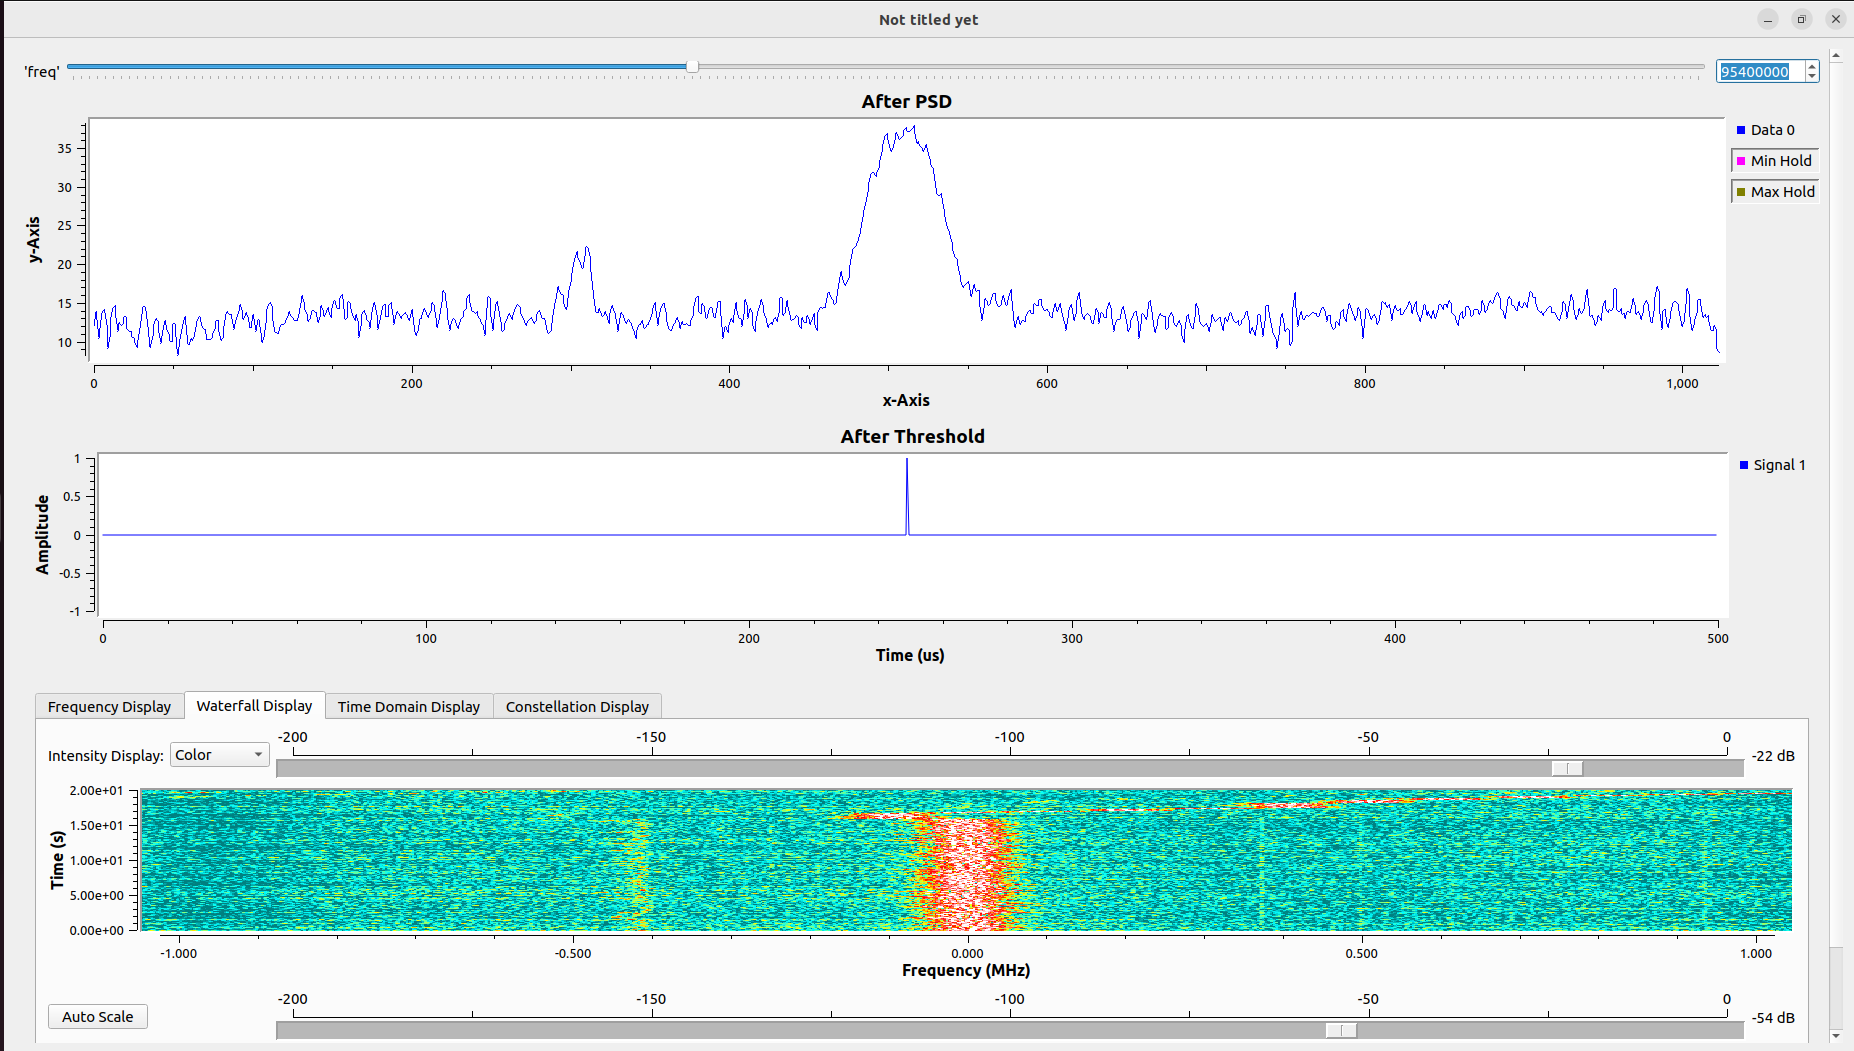
But later, I noticed that the threshold only works because I’m using the my LNA, when i removed it. No stations were detected regardless of the visible peaks, so I had to implement a relative threshold detector. Luckly the Peak Detector 2 block in GNU Radio does that, so I converted the vector back to stream to detect the potential active stations.
And finally its time to convert the 1024 fft bins to their coresponding frequencies, for that I used a embedded python block. It computes the frequency location using this equation:
\[f_i = f_c + \left(i - \frac{N}{2}\right) \cdot \frac{f_s}{N}, \quad \text{for } i = 0, 1, 2, \ldots, N - 1\]And sends the output using a pmt message. The flowgraph until now looks like this:
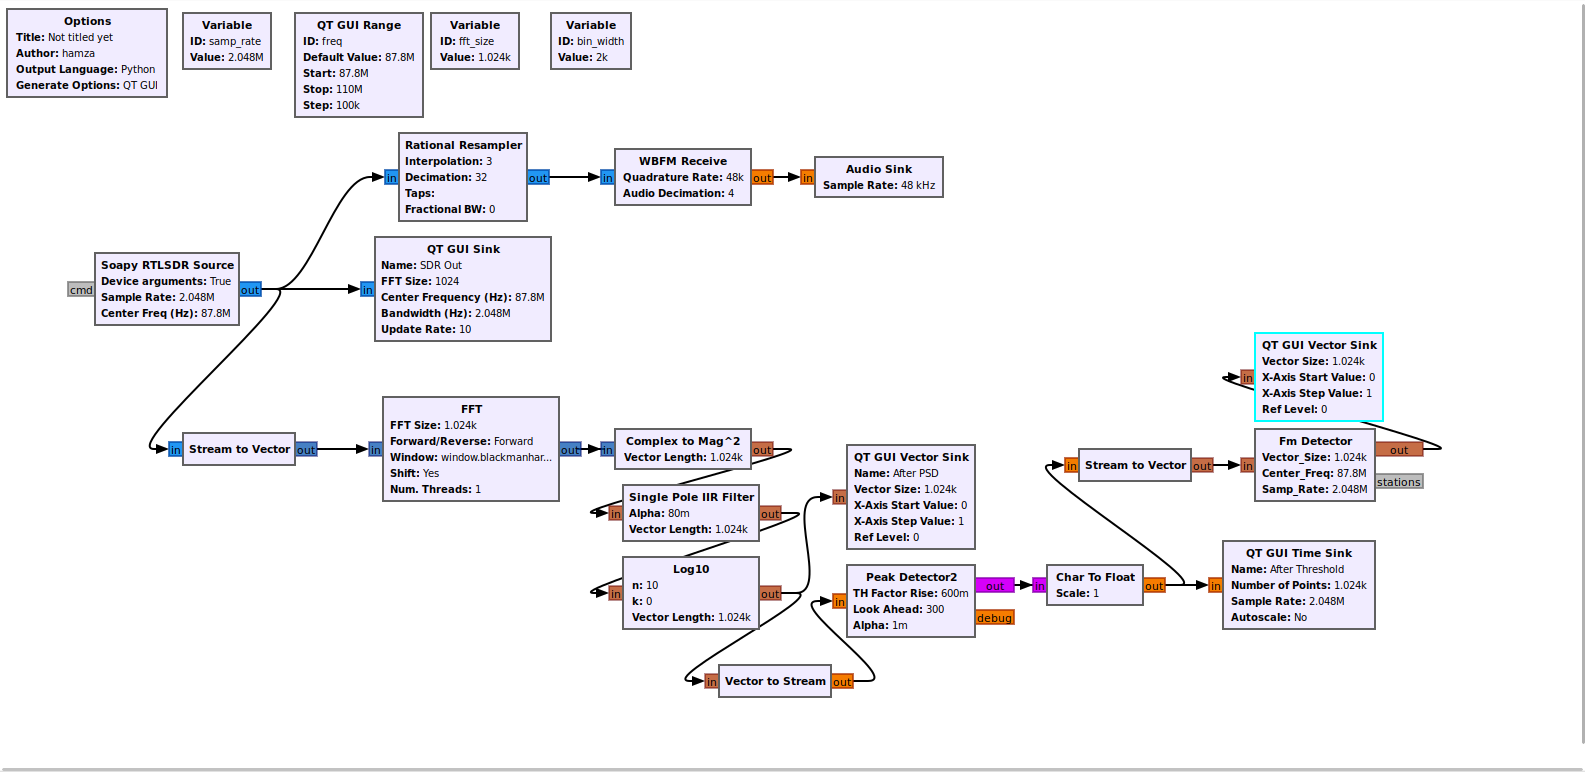
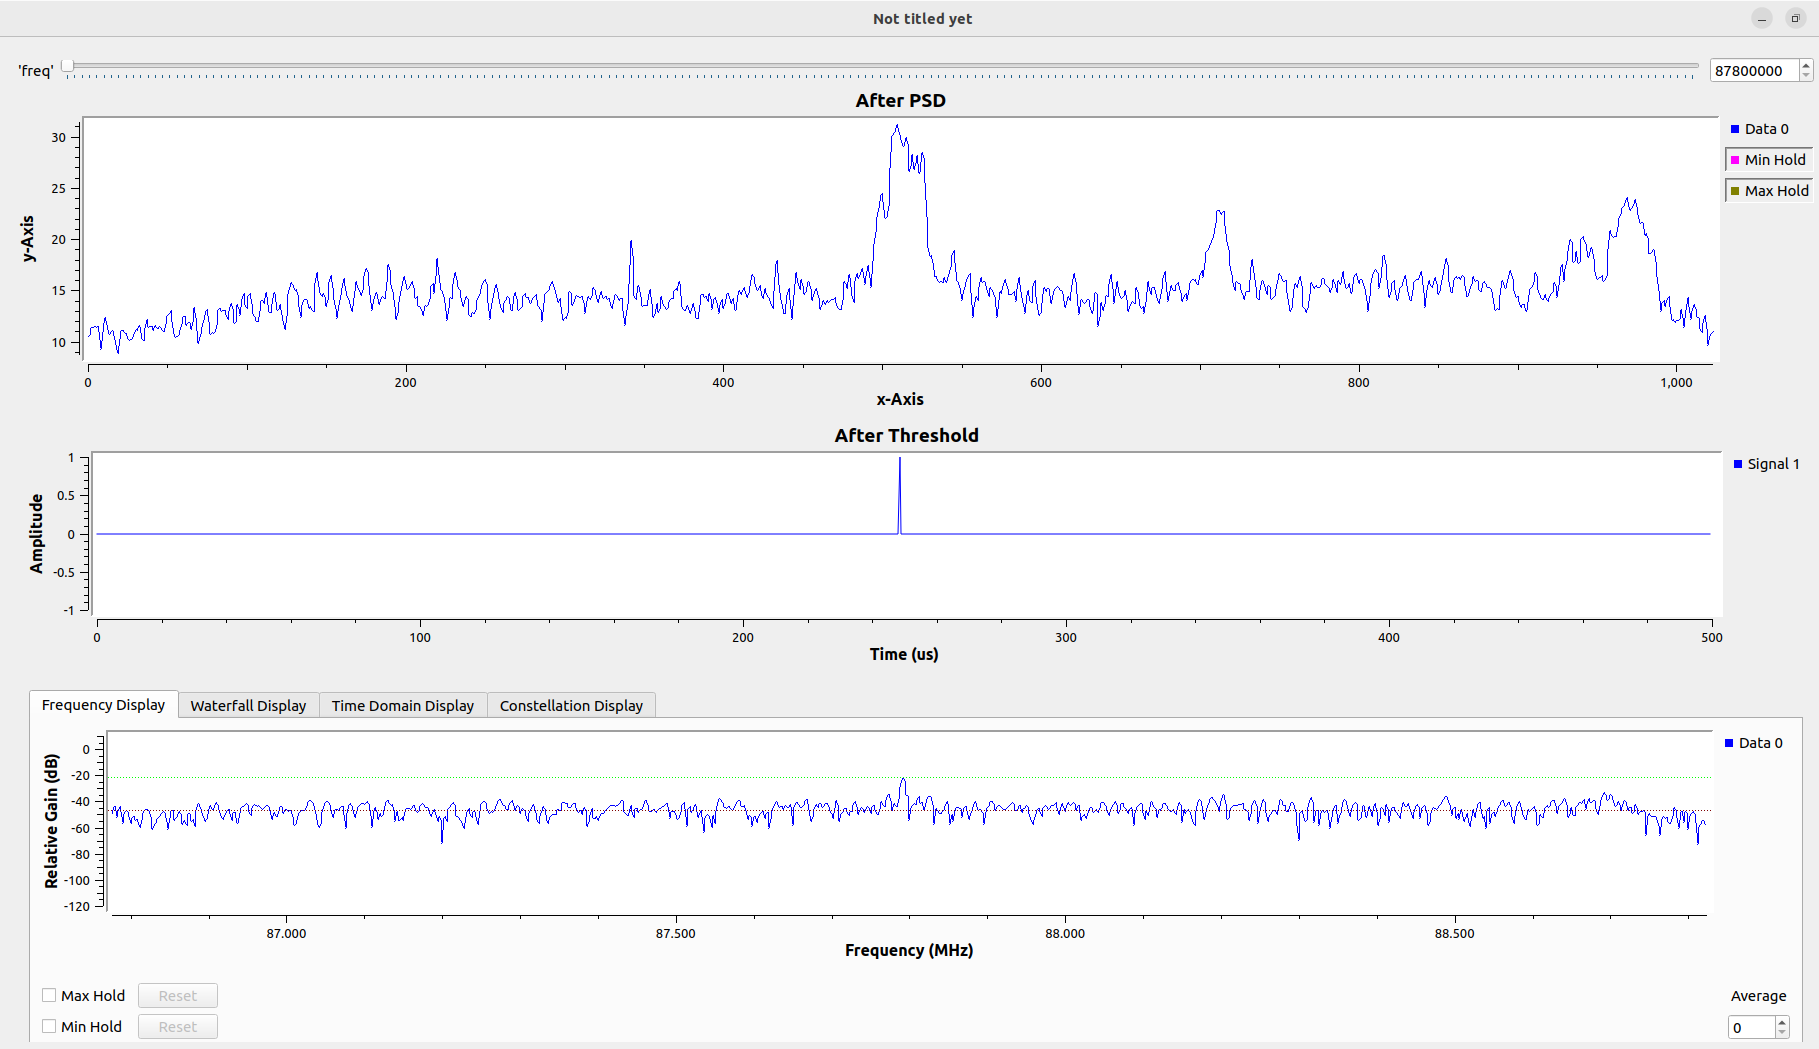
Problems
I’ve faced some difficulties implementing the scanner since some of the blocks only deal with streams (Threshold blocks) and others require vectors. It was also hard to visualize, since GNU Radio sinks lack any features to reverse the X-Y axis during plotting or plot frequency bins. But my biggest problem now is how to remove the variations of the detected stations. The threshold values keep deviating and do not stick to a specific value. One approach is to use an averaging function.
The flow graph continuously outputs PMT messages for detected stations. To filter candidates, apply an exponential moving average to nearby frequencies (frequencies in the same proximity), round the result, and use it to verify the presence of a pilot tone.
What’s Next?
For next week, I’m planning to:
- Countiue working on Frequency scanning & Channel Listing: Station Detection and listing
- Advanced/Debug view
Links
Enjoy Reading This Article?
Here are some more articles you might like to read next: